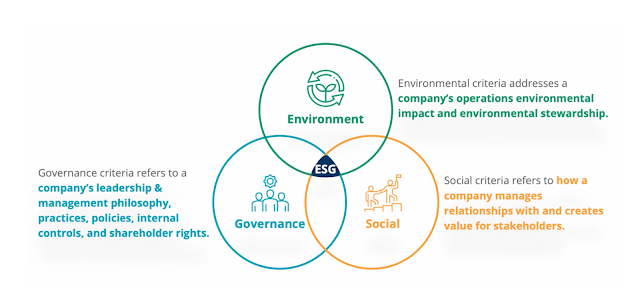
Example of an infographics. image source: https://elearninginfographics.com/ An infographic is a visual representation of information, data, or knowledge that is designed to convey complex concepts or data in a clear, concise, and engaging manner. It combines text, images, charts, graphs, icons, and other visual elements to present information in a visually appealing format that is easy to understand and digest. Infographics are used to simplify complex ideas, highlight trends, compare data, tell stories, and present insights to a wide audience. Key characteristics of infographics include: Visual Elements : Infographics prominently feature visual elements such as images, illustrations, icons, graphs, charts, and diagrams. These visuals are strategically used to enhance the message and make the information more accessible. Data Representation : They often present data in a visual format, making it easier to grasp patterns, trends, and relationships within the data. Bar charts, pie chart...

.jpeg)
